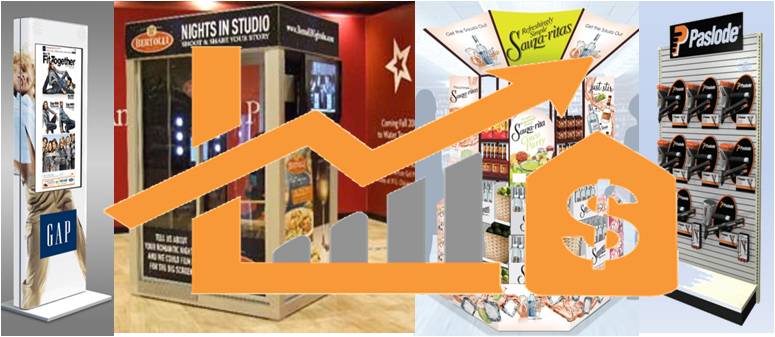
According to Nielsen data 43% of in-store display promotions lose money. But almost half of all US supermarket sales are sold on promotion. This shows how important promotional displays are and how much displays can contribute to a positive overall performance.
In an eye tracking study performed by Eye Faster in 2014 in-store signs were only noted on average by 3% of shoppers and evaluated by only 2% with less than 1% acting on the sign. This also shows how wasteful in-store signage can be and not much thought is given to the development of this type of in-store activation.
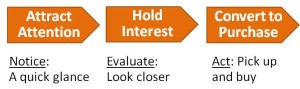
Display Shoppability
Displays need to attract attention which is about the shopper noticing the display. Then it needs to hold the interest of the shopper which manifests itself in the fact that the shopper evaluates the product offer on the display looking closer and reading signs and/or package labels. As the final step, but most important one the display needs to entice the shopper to act converting that attention and interest into an actual purchase.
Display Measurement
There are many ways to measure the performance or return on investment of a display. Of course the revenue a display generates is the most important criteria. But it all depends on multiple variables. At the end of the day the measure should be driven by the objective.
Retail channel
- Industry, category, products, brands
- Size of store
Type of display
- Permanent versus temporary display
- Product presentation versus in-store communication/signage
- End cap, mid aisle, free stranding
Objectives of the display
- Generate (promotional) sales
- Build/enhance brand equity
- Announce an event and link to digital
Display Development
When developing a display it is critical to take the 3 audiences into consideration: Consumer, Retailer and Brand – Nothing new here. The display has to achieve the following objectives to be successful and perform in-store:
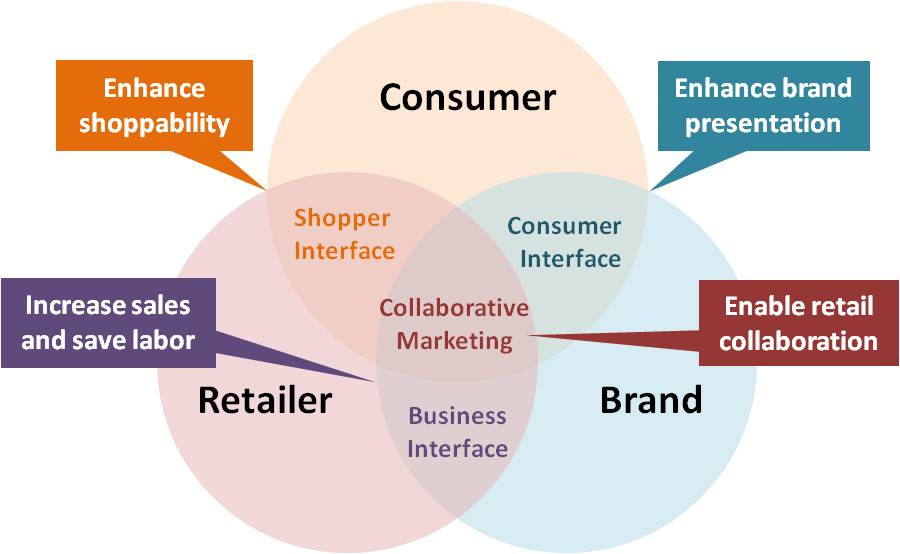 Enhance shoppability: make it easy for the shopper shop – sounds obvious but many displays fall down on that simple objective
Increase sales: attracting the shopper and converting interest into purchase
Save labor costs: make it easy for the retailer to manage the display in terms of mobility, stocking, setup and removal/reuse
Enhance brand presentation: use in-store relevant communication and design/engineer the display so it presents the products and the brand in the best possible way
Enable retail collaboration: make it easy for the retailer to accept the display into the store because it fits the retailer’s objectives, is easy to manage but also meets the brand’s objectives
Display Results
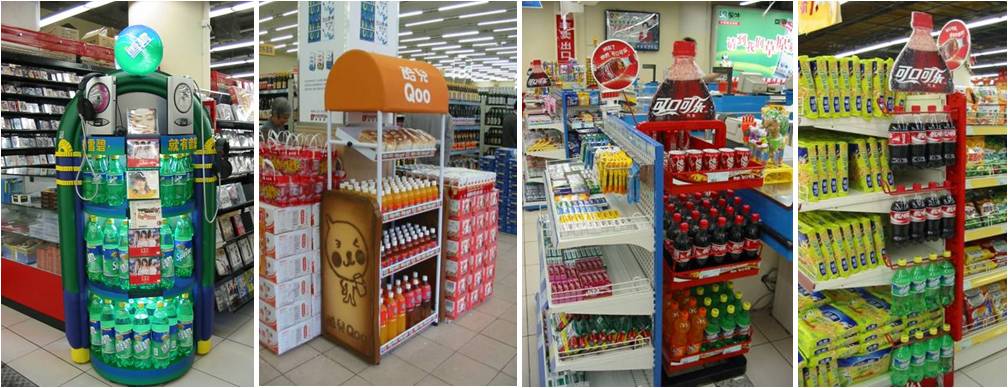
A study of beverage displays across several different locations developed based on specific objectives and shopper insights showed that it is possible to achieve strong display performance when displays are developed based on those strategic insights and objectives:
- The shopper awareness of beverage displays increased between 5-21% dependent on display
- The shopper liking of displays increased between 1-13% dependent on display
- Planned versus actual purchase increased up to 15% dependent on category and up to 75% dependent on brand
- Actual sales contribution based on scanner data varied between 20-50% dependent on display and store
Those are some examples of the displays tested:
For information about this topic by Engage shopper marketing